
Bug #22754
closed
3.1.0 workbench workflow page extreme slowness
Description
Since ver 3.1.0, workflow pages tab in chrome exhibit hangs and get stuck:
- This is mainly CPU based, checked the memory consumption, but it was normal (in this case, for this ticket)
Doesn't seem related to cluster size or wokflog / log size - It tends to happen when the logs / outputs are empty, specially when seting up basic compute on the upgrade so that workflows failed and having no logs was triggered.
- closing the tab and opening other with the same url solves the issue momentarily, but it crops again after some minutes.
Attached image with elevated cpu consumption in chrome
Files
 Updated by Ivan Diaz Alvarez 12 months ago
Forgot to add the page gets unresponsive in this condition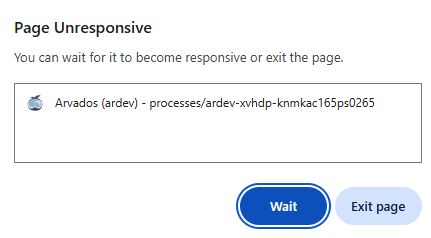
 Updated by Brett Smith 12 months ago
I am also seeing this in Firefox 137. The most reliable way to see it seems to be to start a non-trivial workflow and then leave a browser tab open on the workflow process page. You can tab away but for me when I hear my laptop fan kick in that tells me the tab has wedged itself and needs to be stopped.
Updated by Brett Smith 11 months ago
Ivan confirmed in a meeting that this is seen on queued/running workflows, not completed-and-failed ones. In his particular case, the user was monitoring a workflow that was impossible to dispatch, so it was stuck in the queued state.
 Updated by Peter Amstutz 11 months ago
In the "queued" state, it polls for container status. This may have some unreasonable resource leak.
In the "running" state, it collects runtime logs. This also may have some unreasonable resource leak, but the polling mechanism for logs is different from the polling mechanism for container status used in the "queued" state.
I suggest the following tests to reproduce/diagnose the problem:
- Leave the browser on a page in "Queued" state for several minutes with the javascript profiler active.
- Leave the browser on a page in "Running" state for several minutes with the javascript profiler active.
Updated by Peter Amstutz 11 months ago
- File process-panel-stuck.png process-panel-stuck.png added
I had this happen and I had the wherewithal to get a look at it in the Firefox debugger:
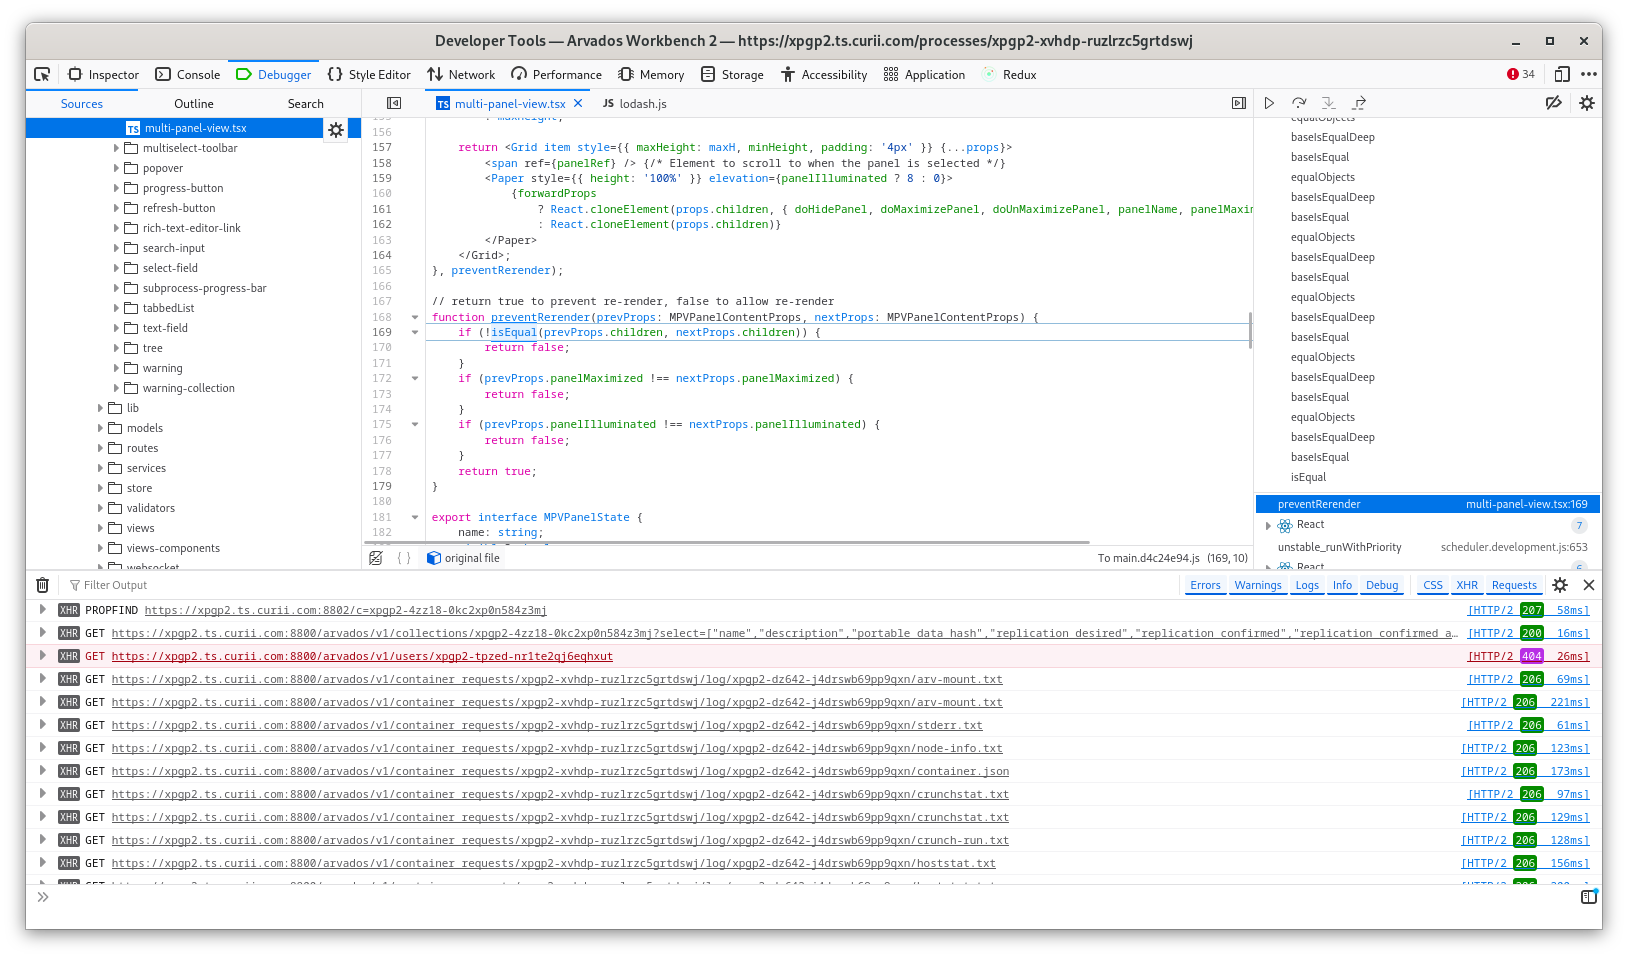
The stack trace on the right continues to scroll up for hundreds of method calls, but basically it seem that doing deep equality on MPVPanelContentProps is either extremely expensive or actually stuck in an infinite loop (it is hard to say which) -- it appears, among other things, that it is probably doing a line-by-line comparison of the contents of the log viewer.
Updated by Peter Amstutz 11 months ago
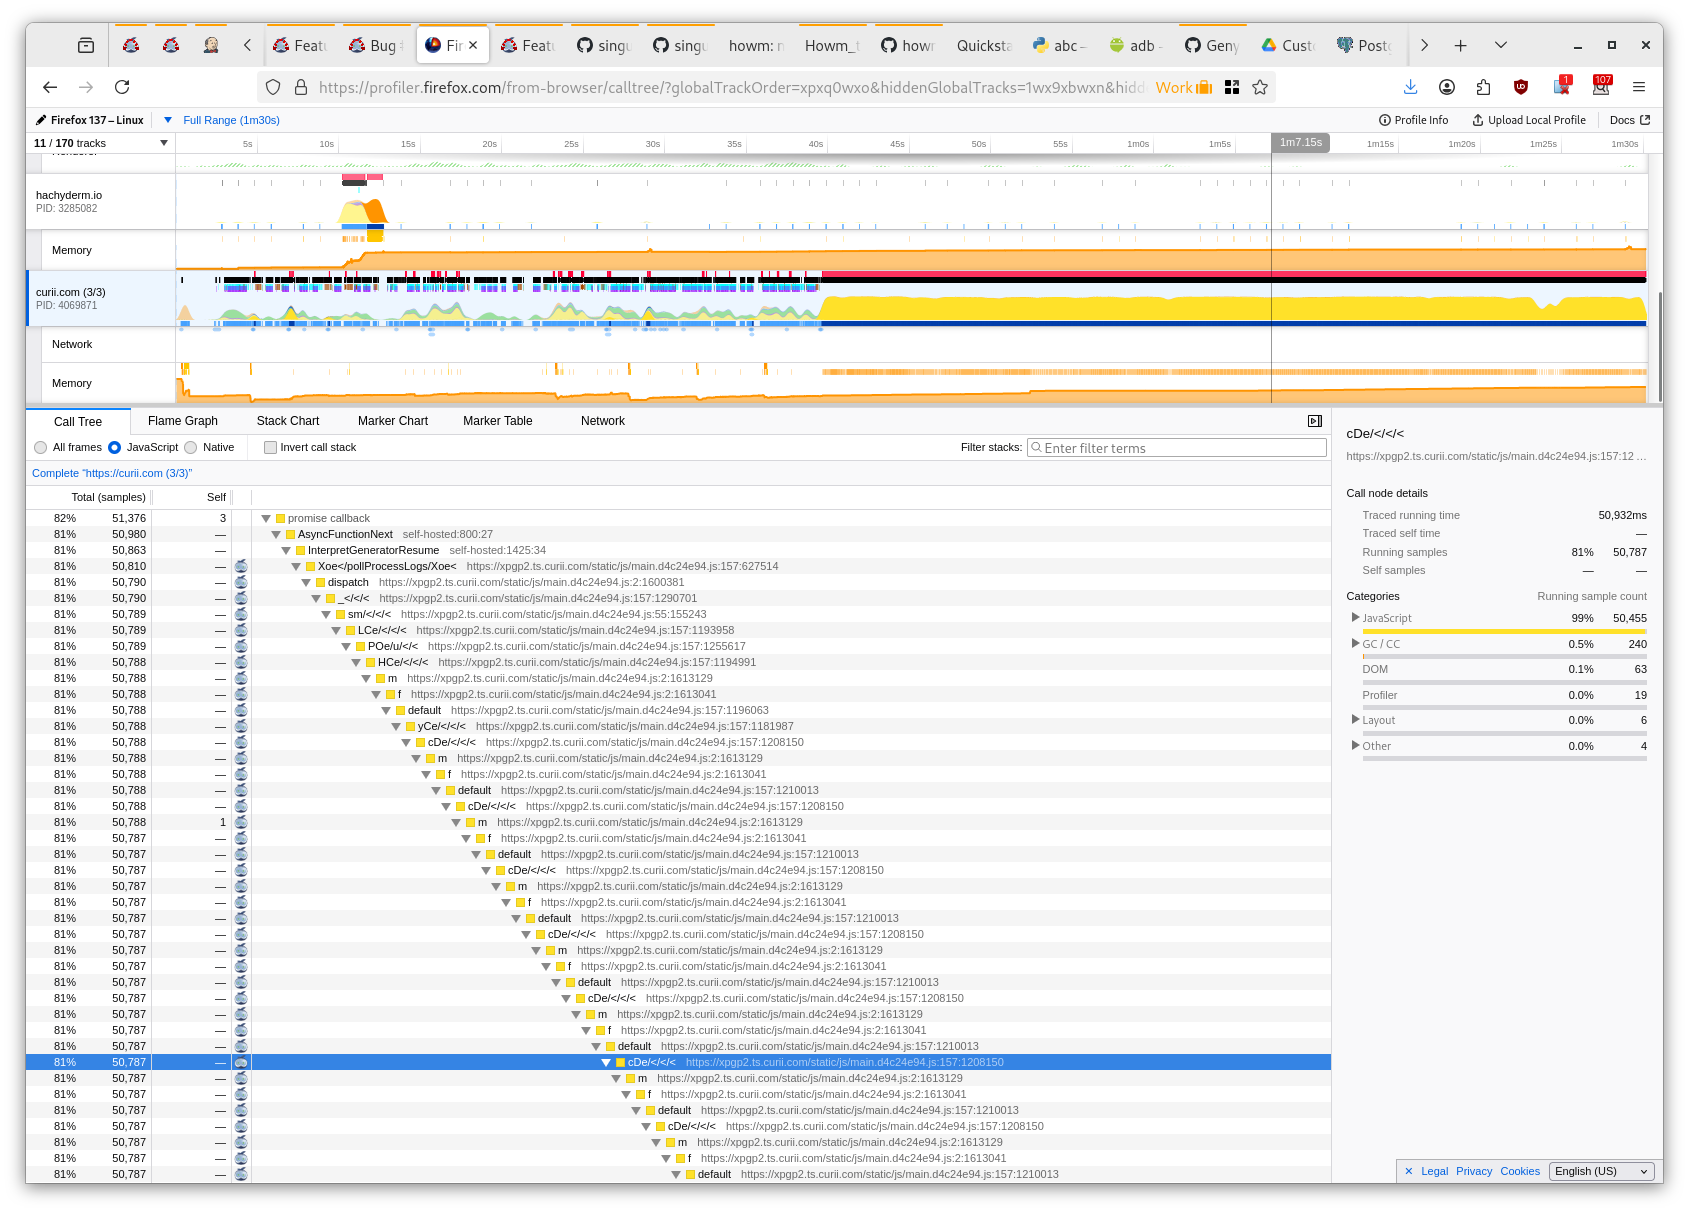
Here's the profiler:
 Updated by Stephen Smith 11 months ago
- Status changed from New to In Progress
Changes pushed to 22754-process-panel-slowness - removed memoization from MPVPanelContent.
I realized that it wouldn't be feasible to keep partial memoization based on the other parameters since it would memoize entirely based on the MPV props, so I removed it.
Updated by Peter Amstutz 11 months ago
- File queued-state-jank.png queued-state-jank.png added
Stephen Smith wrote in #note-13:
Changes pushed to 22754-process-panel-slowness - removed memoization from MPVPanelContent.
I realized that it wouldn't be feasible to keep partial memoization based on the other parameters since it would memoize entirely based on the MPV props, so I removed it.
So, I ran a workflow and I didn't have any issues. However based on the previous evidence I think we should merge the change which removes the memoization and keep an eye on it to see if there are any other issues.
I did notice some stutter while in the "Queued" phase. I think this is un-related slowness that was there before.
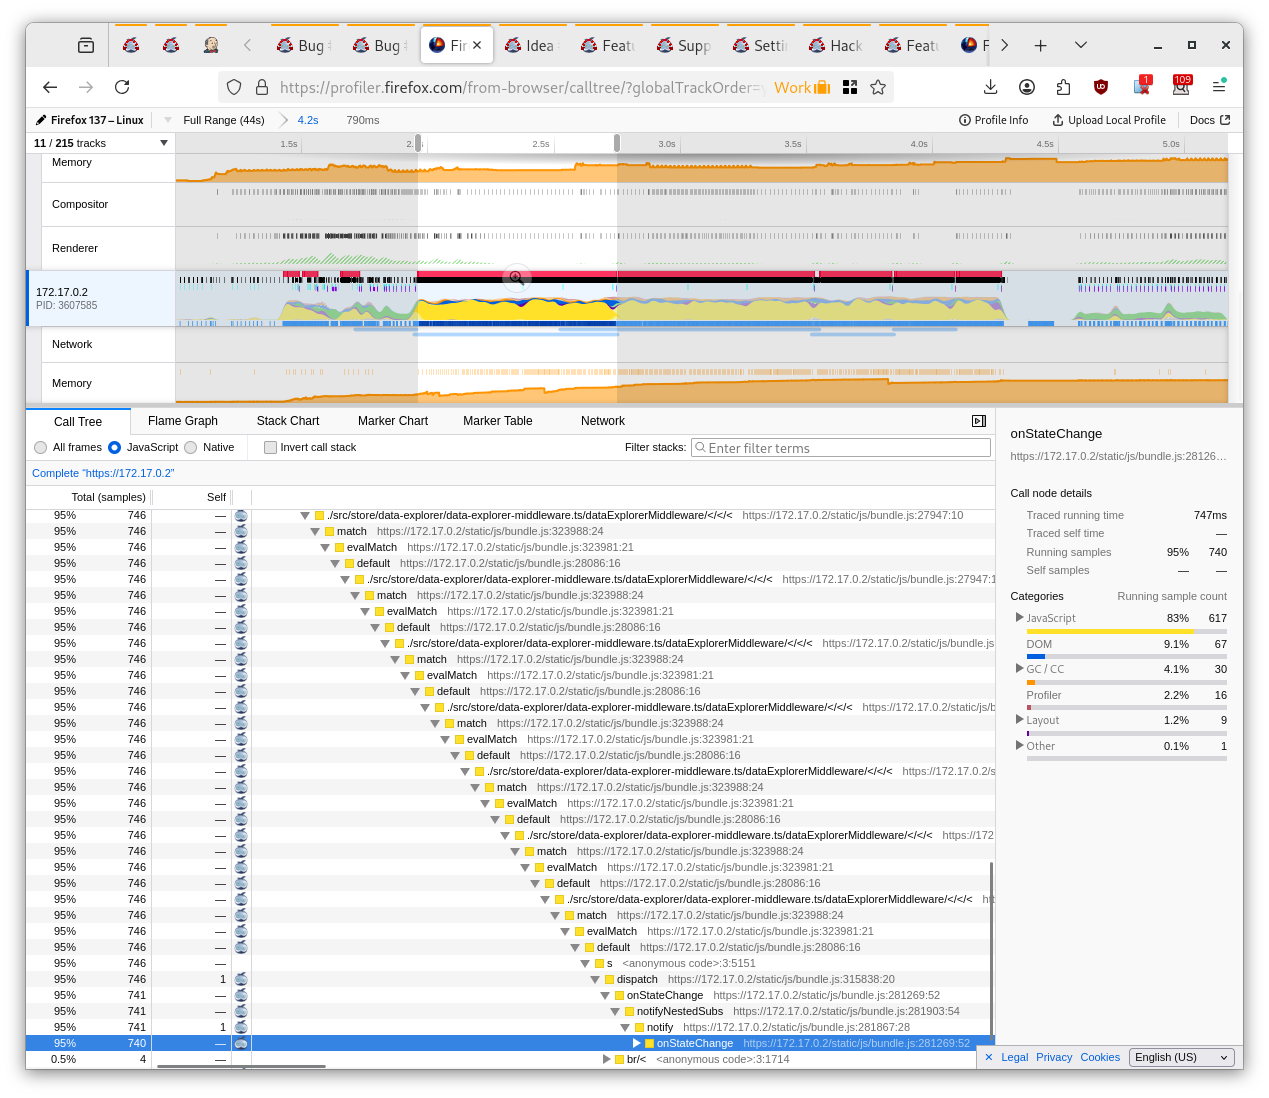
It is hard to tell from the stack trace what is happening but my best guess is that it is doing a pretty expensive re-render (700ms, twice, so that's like 1.5s), that probably isn't really necessary (because everything looks fine before it happens) but I would have to match this with a redux event and I don't have time to do that right now. My test process is to just start a process run, start the profiler, and scroll up and down with the mouse wheel while it is in the "queued" phase and watch for significant delays in scrolling that make the app feel slow.
Updated by Stephen Smith 11 months ago
- Status changed from In Progress to Resolved
Tests developer-run-tests-services-workbench2: #1518
Applied in changeset arvados|d7a75a4b8790d02aa95977f3c9ea799e20948c70.