Bug #23083
closed
Data explorer apparently enters an infinite loop (sometimes?) when loading All Processes
Description
Steps to reproduce:
- Have a lot (100+) of processes running.
- Open Workbench.
- Open the All Processes page.
Looking at the network inspector, sometimes we catch a bunch of alternating groups/contents API calls running in rapid succession (> 100/sec). Given the way they alternate, initial theory is that data explorer might be stuck in an infinite loop.
Related: sometimes when opening All Processes, it never shows the listing, instead the top loading bar keeps stuttering. Suspect this is a side effect of the initial bug, but we should try to confirm both are fixed as part of this.
Files
 Updated by Lucas Di Pentima 8 months ago
On normal operation (all processes view listing visible) requests happen in pairs to the following endpoint:
https://api.example.com/arvados/v1/groups/contents?limit=50&offset=0&count=none&filters=[[%22uuid%22,%22is_a%22,%22arvados%23containerRequest%22],[%22container_requests.requesting_container_uuid%22,%22%3D%22,null]]&order=created_at+desc,created_at+desc&select=[%22command%22,%22container_count_max%22,%22container_count%22,%22container_image%22,%22container_uuid%22,%22created_at%22,%22cumulative_cost%22,%22cwd%22,%22description%22,%22environment%22,%22etag%22,%22expires_at%22,%22filters%22,%22kind%22,%22log_uuid%22,%22modified_at%22,%22modified_by_user_uuid%22,%22name%22,%22output_name%22,%22output_path%22,%22output_properties%22,%22output_storage_classes%22,%22output_ttl%22,%22output_uuid%22,%22output_glob%22,%22owner_uuid%22,%22priority%22,%22properties%22,%22requesting_container_uuid%22,%22runtime_constraints%22,%22scheduling_parameters%22,%22state%22,%22use_existing%22,%22uuid%22,%22can_write%22,%22can_manage%22,%22auth_uuid%22,%22command%22,%22container_image%22,%22cost%22,%22created_at%22,%22cwd%22,%22environment%22,%22etag%22,%22exit_code%22,%22finished_at%22,%22gateway_address%22,%22interactive_session_started%22,%22kind%22,%22lock_count%22,%22locked_by_uuid%22,%22log%22,%22modified_at%22,%22modified_by_user_uuid%22,%22output_path%22,%22output_properties%22,%22output_storage_classes%22,%22output%22,%22owner_uuid%22,%22priority%22,%22progress%22,%22runtime_auth_scopes%22,%22runtime_constraints%22,%22runtime_status%22,%22runtime_user_uuid%22,%22scheduling_parameters%22,%22started_at%22,%22state%22,%22subrequests_cost%22,%22uuid%22]&include=[%22owner_uuid%22,%22container_uuid%22]
First an OPTIONS req and then a GET req.
Production cluster in question is running ~280 containers, and I left the browser in the "all processes" page for 1.4h and the browser's inspector recorded 13000 requests, averaging ~2.6 req/s (not sure if this is close enough to a 1 refresh per second polling cycle), the OPTIONS request takes 20ms to 30ms and the GET request 300ms to 400ms.
When seeing the empty listing, requests happen in groups of 3, an OPTIONS and a GET to the endpoint above and then a GET to:
https://api.example.com/arvados/v1/groups/contents?limit=0&count=exact&filters=[[%22uuid%22,%22is_a%22,%22arvados%23containerRequest%22],[%22container_requests.requesting_container_uuid%22,%22%3D%22,null]]
Which takes around 200ms.
In this case, I'm seeing an avg of 4 req/s (2400 reqs in 600 secs in my test), also somewhat close to the "1 poll/s cycle"
 Updated by Stephen Smith 8 months ago
That's interesting if your normal operation case doesn't have a limit=0 count=exact as well as the limit=50 pair of requests (it should at least have a count=exact request for the total count once even if it doesn't repeat that one).
Judging from the video it looks like it's just waiting for the request pair (of limit=50 and limit=0) to finish before it loops again. The fact that there is no error toast and the requests come back 200 suggests that it might not be hitting the catch block in data-explorer-middleware.ts:L86, which resets the DE to NEEDS_REFRESH and theoretically could cause an infinite refresh and is one theory - the only way I can think of that would cause a single instance of the DE middleware to loop like this. So if it is, then the question would be how it's falling to the catch block despite successful requests.
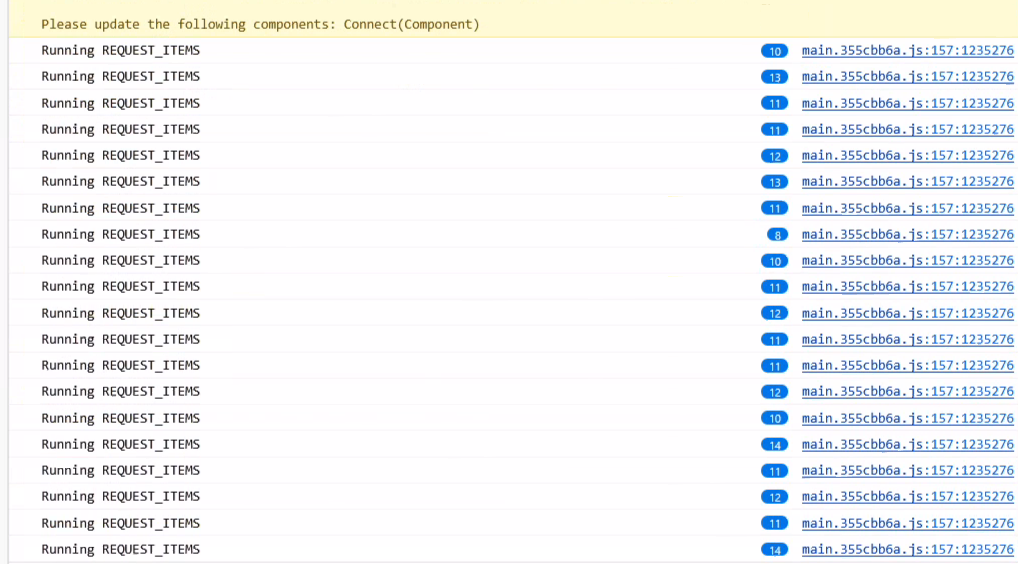
The only path to REQUEST_ITEMS for all processes seems to be through loadAllProcessesPanel, so if the DE itself isn't looping then perhaps that is getting called repeatedly somehow, or it might be possible (it seems unlikely though) that there are 2 DE finite state machines that are fighting.
Those are my theories so far, it's hard to narrow down without being able to add debug logs.
Updated by Stephen Smith 8 months ago
- File main.f13f9a3e.js main.f13f9a3e.js added
Here is a JS bundle with added logging, it will log whenever the DE reaches the catch block and the error that caused it (which in theory would trigger an infinite loop) as well as log when the REQUEST_ITEMS middleware is run, as well as when loadAllProcessesPanel is called (hopefully only once).
To use, load WB, open the debugger, disable source maps in the cog menu, (maybe reload again), right click the main.xxx.js in the debugger and add a script override, save the copy somewhere, overwrite the saved copy with the debug copy, reload again, and see what gets logged.
Updated by Lucas Di Pentima 8 months ago
- File wb-test.png wb-test.png added
Stephen Smith wrote in #note-4:
Here is a JS bundle with added logging, it will log whenever the DE reaches the catch block and the error that caused it (which in theory would trigger an infinite loop) as well as log when the REQUEST_ITEMS middleware is run, as well as when loadAllProcessesPanel is called (hopefully only once).
To use, load WB, open the debugger, disable source maps in the cog menu, (maybe reload again), right click the main.xxx.js in the debugger and add a script override, save the copy somewhere, overwrite the saved copy with the debug copy, reload again, and see what gets logged.
 Updated by Brett Smith 8 months ago
- Target version set to Development 2025-08-21
Updated by Stephen Smith 8 months ago
- File main.debug.js added
- File main.debouncedws.js main.debouncedws.js added
I have a new hunch and I also added tons more logging and tracing - I remembered that the websocket listener can also trigger a DE refresh so I logged that, and also added traces to every other possible source of DE refresh to hopefully save time in tracing the path.
If this logs messageListener with each refresh with the debug version, then the debouncedws version should be a proof of concept fix that should throttle it to 1 refresh per 10 seconds (though I think if this is the cause, the best fix would be to queue / dedupe redundant refreshes and ensure it triggers a background refresh transparent to the user)
Updated by Stephen Smith 8 months ago
- File main.debug.js main.debug.js added
(added a little bit more logging to the debug version)
Updated by Stephen Smith 8 months ago
The culprit was identified to be the websocket listener spamming data explorers with refresh. Since the DE's are blindly refreshed regardless of the UUID of the websocket notification, it should be sufficient to simply throttle the DE refreshes triggered by the WS notifications.
Note: Using debounce doesn't actually work since WS spam will indefinitely hold up the debounce, so a throttle method that will allow through a call at a maximum interval should be used
Note 2: The background and criteriaChanged flags get pinned to initial values when REQUEST_ITEMS is spammed due to the initial DE thread being reused for subsequent requests. Not sure if this should be changed so that background refreshes triggered during a user-initiated load don't hitch a ride onto the thread that displays a loading indicator but something to consider.
Updated by Stephen Smith 7 months ago
Changes at arvados|93cbca9035d727ba8fa4b6a4fbe6d4f34d0846dd branch 23083-websocket-throttling
Tests developer-run-tests-services-workbench2: #1567
- All agreed upon points are implemented / addressed.
- There were 2 main changes I made:
- The websocket listener now maintains a set of lodash throttles for each data explorer which limits refresh requests to once per 15 seconds (set pretty conservatively since each refresh also triggers a set of 8 requests for the container status total display for the status filter menu, and something closer to 5s is still pretty close to a constant stream of requests, and 15 seconds seems about right for a passive background refresh).
- The second piece of the puzzle is exempting background refreshes from placing a
PENDINGDE intoNEEDS_REFRESH. This is what caused the infinite loading screen despite the DE finishing. Because of the way the DE works, triggering a refresh while the DE already loading is done by moving the state intoNEEDS_REFRESHand exiting, then the original thread simply loops when it sees that another thread requested a refresh. The result is that the flags of the original thread are used, includingbackgroundandcriteriaChanged. So if the original request wasbackground=falseand you spam background refreshes, the flag never gets updated. One possible solution I considered was restructuring the DE some to ensure the most recent refresh flags are set, but since that seemed like a lot more work, since this is only an issue with a rapid succession of non-user initiated refreshes, and also since ignoring background refreshes duringPENDINGrefreshes also makes sense and solves the problem, I decided that would be the best solution for now.- With this change, normal background refreshes load as normal, but if the DE is already in
PENDING(loading) and the new request isbackground=true, it will simply exit and not queue another refresh. My reasoning is that background refreshes don't change criteria, so there is no need to make another refresh if it's already loading the DE with up-to-date info. This prevents the possibility of a background refresh inheriting incorrect flags likebackgroundandcriteriaChanged.
- With this change, normal background refreshes load as normal, but if the DE is already in
- With both changes, refreshes triggered by WS are throttled to a reasonable interval, and no longer have the capability to incorrectly display the loading screen even if a normal refresh happens to take so long that a background refresh happens before the normal refresh is finished (so we aren't making any assumptions about the speed of the cluster).
- There were 2 main changes I made:
- Anything not implemented (discovered or discussed during work) has a follow-up story.
- none
- Code is tested and passing, both automated and manual, what manual testing was done is described
- Passed manual tests which involved spamming the WS handler with fake container updates
- I added a component test case which initializes the websocket handler and sends 5 fake update messages, then verifies that dispatch was only called once
- Since the component tests seem to fast forward time, there doesn't seem to be a need for actual waiting. I verified that it correctly tests the dispatch call count by removing the throttles and seeing that the test sees 5 calls to dispatch instead of 1.
- Documentation has been updated.
- n/a
- Behaves appropriately at the intended scale (describe intended scale).
- No change besides handling a larger scale of websocket messages
- Considered backwards and forwards compatibility issues between client and server.
- no changes to compatibility
- Follows our coding standards and GUI style guidelines.
- yes
 Updated by
Updated by Stephen Smith 7 months ago
- Status changed from In Progress to Resolved
Updated by Stephen Smith 7 months ago
- Related to Bug #23117: Websocket flood slows down process page added
Updated by Lucas Di Pentima 7 months ago
- Related to Bug #21879: Cannot change page size on Workbench's "All Processes" page (when cluster is busy?) added