Support #23235
closed
Instrument keep-balance RAM use
Description
We want to better understand why keep-balance uses so much RAM in a large run so we can investigate opportunities to reduce usage. Document in this ticket how to run it in a way that generates a profiling report useful to developers. If development is necessary for that to happen, that development is in scope for this ticket: prepare a branch.
Writing instructions in documentation like the admin guide is a great thing to do too.
Files
 Updated by Brett Smith 5 months ago
- Status changed from In Progress to New
- Description updated (diff)
 Updated by Tom Clegg 5 months ago
The rough version:
Create /etc/systemd/system/keep-balance.service.d/override.conf
[Service]
ExecStart=
ExecStart=/usr/bin/keep-balance -pprof :3333
Reload
systemctl daemon-reload
systemctl restart keep-balance
The rest can be done on a different machine as long as it can connect to that port 3333 somehow.
Install the Go runtime.
Get a heap snapshot:
go tool pprof -text 'http://localhost:3333/debug/pprof/heap?gc=1'- save a snapshot in a file like /root/pprof/pprof.keep-balance.alloc_objects.alloc_space.inuse_objects.inuse_space.001.pb.gz
- output a text summary of memory allocations
There is also a web UI. Install graphviz first, so it can generate dot graphs.
go tool pprof -http :4444 -no_browser 'http://localhost:3333/debug/pprof/heap?gc=1'You can also run the UI or generate a text report from a saved snapshot.
go tool pprof -http :4444 -no_browser /root/pprof/pprof.keep-balance.alloc_objects.alloc_space.inuse_objects.inuse_space.001.pb.gzExample text report from tordo:
Fetching profile over HTTP from http://localhost:6767/debug/pprof/heap?gc=1
Saved profile in /root/pprof/pprof.keep-balance.alloc_objects.alloc_space.inuse_objects.inuse_space.004.pb.gz
File: keep-balance
Build ID: 218d12604d3d83cd11dab6fd89c3d8e767c14a75
Type: inuse_space
Time: 2025-10-30 18:01:23 UTC
Showing nodes accounting for 133.98MB, 97.78% of 137.01MB total
Dropped 27 nodes (cum <= 0.69MB)
      flat  flat%   sum%        cum   cum%
   71.01MB 51.83% 51.83%    71.01MB 51.83%  git.arvados.org/arvados.git/services/keep-balance.(*BlockState).increaseDesired (inline)
   22.74MB 16.59% 68.42%    22.74MB 16.59%  git.arvados.org/arvados.git/services/keep-balance.(*BlockStateMap).get (inline)
      16MB 11.68% 80.10%    18.50MB 13.51%  git.arvados.org/arvados.git/sdk/go/arvados.(*Collection).SizedDigests
       5MB  3.65% 83.75%        6MB  4.38%  github.com/lib/pq.textDecode
       5MB  3.65% 87.40%        5MB  3.65%  bufio.(*Scanner).Text (inline)
    2.50MB  1.83% 89.23%     2.50MB  1.83%  github.com/lib/pq.(*conn).recvMessage
    2.50MB  1.83% 91.06%     2.50MB  1.83%  bytes.genSplit
       2MB  1.46% 92.52%       15MB 10.95%  git.arvados.org/arvados.git/services/keep-balance.EachCollection
    1.72MB  1.25% 93.77%     6.72MB  4.90%  git.arvados.org/arvados.git/sdk/go/arvados.(*KeepService).index
    1.50MB  1.09% 94.87%     3.50MB  2.55%  encoding/json.Unmarshal
    1.50MB  1.09% 95.96%     1.50MB  1.09%  encoding/json.(*scanner).pushParseState
       1MB  0.73% 96.69%        1MB  0.73%  github.com/lib/pq.parseTs
       1MB  0.73% 97.42%        1MB  0.73%  reflect.New
    0.50MB  0.36% 97.78%     3.03MB  2.22%  runtime.main
         0     0% 97.78%     2.50MB  1.83%  bytes.Split (inline)
         0     0% 97.78%     8.50MB  6.21%  database/sql.(*Rows).Next
         0     0% 97.78%     8.50MB  6.21%  database/sql.(*Rows).Next.func1
         0     0% 97.78%        1MB  0.73%  database/sql.(*Rows).Scan
         0     0% 97.78%     8.50MB  6.21%  database/sql.(*Rows).nextLocked
         0     0% 97.78%        1MB  0.73%  database/sql.convertAssignRows
         0     0% 97.78%     8.50MB  6.21%  database/sql.withLock
         0     0% 97.78%     1.50MB  1.09%  encoding/json.checkValid
         0     0% 97.78%     1.50MB  1.09%  encoding/json.stateBeginValue
         0     0% 97.78%     6.72MB  4.90%  git.arvados.org/arvados.git/sdk/go/arvados.(*KeepService).IndexMount
         0     0% 97.78%     6.72MB  4.90%  git.arvados.org/arvados.git/services/keep-balance.(*Balancer).GetCurrentState.func1
         0     0% 97.78%       15MB 10.95%  git.arvados.org/arvados.git/services/keep-balance.(*Balancer).GetCurrentState.func2
         0     0% 97.78%   112.25MB 81.93%  git.arvados.org/arvados.git/services/keep-balance.(*Balancer).GetCurrentState.func3
         0     0% 97.78%   112.25MB 81.93%  git.arvados.org/arvados.git/services/keep-balance.(*Balancer).addCollection
         0     0% 97.78%    93.75MB 68.42%  git.arvados.org/arvados.git/services/keep-balance.(*BlockStateMap).IncreaseDesired
         0     0% 97.78%     2.50MB  1.83%  github.com/lib/pq.(*conn).recv1Buf
         0     0% 97.78%     8.50MB  6.21%  github.com/lib/pq.(*rows).Next
         0     0% 97.78%        6MB  4.38%  github.com/lib/pq.decode
         0     0% 97.78%     1.03MB  0.75%  regexp.Compile (inline)
         0     0% 97.78%     1.03MB  0.75%  regexp.MustCompile
         0     0% 97.78%     1.03MB  0.75%  regexp.compile
         0     0% 97.78%     2.53MB  1.85%  runtime.doInit (inline)
         0     0% 97.78%     2.53MB  1.85%  runtime.doInit1
Updated by Tom Clegg 5 months ago
Meanwhile, here's a branch fixing two keep-balance memory leaks.
23235-keep-balance-mem-leak @ fa40e06207670bf38cb316b39f7669d7893f2b9a -- developer-run-tests: #4930
Testing on tordo, this brings memory usage down from 430M to 9M during idle periods (between sweeps).
Also fixes an unrelated bug that caused a lot of collection row updates that were actually no-ops.
Updated by Brett Smith 5 months ago
Tom Clegg wrote in #note-6:
23235-keep-balance-mem-leak @ fa40e06207670bf38cb316b39f7669d7893f2b9a -- developer-run-tests: #4930
My one comment is that IMO the "check storage class replication" loop would be a little easier to follow written like:
if !needUpdate && repl > 0 {
    for i := range coll.StorageClassesDesired {
        if coll.StorageClassesDesired[i] != coll.StorageClassesConfirmed[i] {
            needUpdate = true
            break
        }
    }
}
But this is small and subjective. LGTM whether you take this or not.
Testing on tordo, this brings memory usage down from 430M to 9M during idle periods (between sweeps).
Any idea about impact on peaks?
Updated by Tom Clegg 5 months ago
Brett Smith wrote in #note-8:
But this is small and subjective. LGTM whether you take this or not.
Taken, thanks.
Any idea about impact on peaks?
The DBLock issue only affected idle periods since the lingering reference was released when the next run started.
The reportMemStats issue would retain the reference indefinitely, which would have caused memory usage to grow with each sweep until OOM/restart. However, based on pirca and tordo logs, I suspect the Go runtime might have been smart enough to notice the reportMemStats goroutine was blocked on a timer channel for which there was no remaining sender reference, and therefore it would never run, so its references could be garbage collected.
I don't think this will have a noticeable effect on peak usage -- maybe just a tiny bit because run N's data structures are now guaranteed to be garbage collected before run N+1 starts.
Updated by Tom Clegg 5 months ago
"Memory and CPU profiling" documentation page:
23235-doc-mem-cpu-profiling @ 9b0a1db2c1bc8579fa27e0c76dc649345dc4e75b
Updated by Brett Smith 5 months ago
Tom Clegg wrote in #note-10:
23235-doc-mem-cpu-profiling @ 9b0a1db2c1bc8579fa27e0c76dc649345dc4e75b
For linkcheck: developer-run-tests-doc-sdk-java-R: #2258
What's written is good. The steps connect clearly and the demonstration output is helpful to understand what I'll get out of it.
I think explaining the different ways to generate the report in a tiny bit at the bottom is a little unfortunate. I think we could explain all the current points with a more natural flow with an ordering like:
- Arvados services can expose profiling information over an HTTP endpoint.
go tool pproffrom the Go runtime can turn this information into a human-readable report.go tool pprofcan connect to the HTTP endpoint directly or read output saved to disk.- Documentation of how to set up the HTTP endpoint for a service.
- Examples - These could explain the different parameters like the current endpoints do, and also work in a direct HTTP connection vs. reading from disk.
Mostly I think it's friendly to explain point 3 before we get into step 4 because having that information could very well affect endpoint setup. In a lot of our users' environments, it's much easier and safer to set up the endpoint on localhost; grab a snapshot; and transfer it to another system with Go installed. Yes that's more steps, but it has much less impact on the security posture of a cluster in production.
And yes, this does front-load some information, but again, the audience for this page is admins who are specifically looking for low-level debugging information. It is reasonable to expect them to be more invested; being frictionless doesn't need to be a goal for this specific page.
Let me know how that sounds. Thanks.
Updated by Tom Clegg 5 months ago
Yes, that all makes sense. How about this?
23235-doc-mem-cpu-profiling @ 8f6a4d60a3be3b773661525c1b1c28319773588b
Updated by Tom Clegg 5 months ago
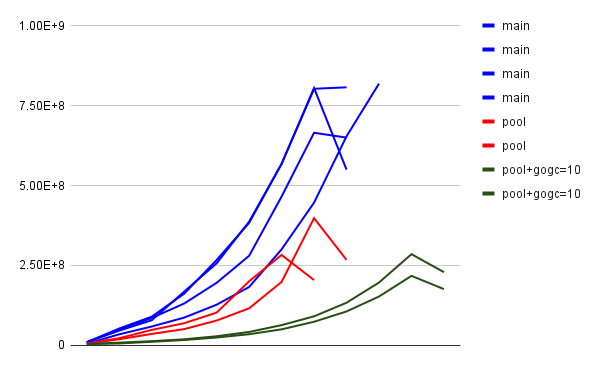
- File 23235-trials-2.png 23235-trials-2.png added
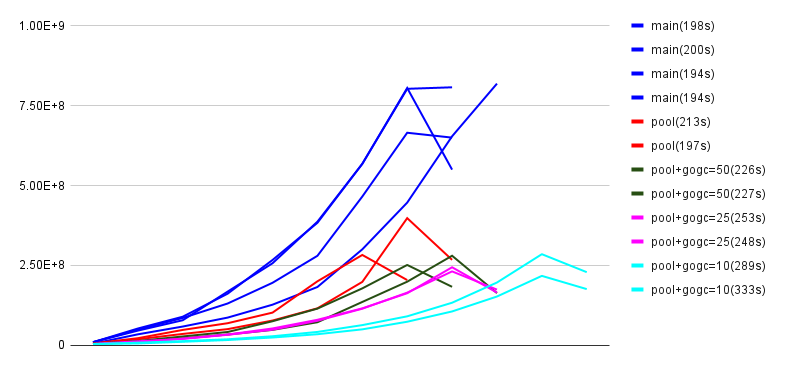
23235-desired-pool implements a pool of storage_class→desired_replication maps where the previous code had a map[string]int for each stored block. This reduces memory usage because the number of distinct maps is much smaller than the number of blocks.
The above chart shows memory usage (samples reported by keep-balance) for several trial runs on tordo.- x axis is just sample number, and doesn't correspond exactly to time because samples are reported when memory usage grows more than 40% since the last sample, plus once at the end, rather than on a timer
- y axis shows approximate peak memory usage, but this is not precise for the same sampling reason
- "gogc" series combine the new pool feature with setting GOGC to values lower than the default 100
- 23235-desired-pool reduces peak memory usage by about 50% with no performance penalty
- GOGC=50 further reduces peak memory usage by about 25% with a 10% performance penalty
- GOGC=25 or 10 has a bigger performance penalty without a significant reduction in memory use
...therefore it makes sense to add Environment=GOGC=50 to keep-balance.service.
23235-desired-pool @ 1e25a8517ec617927b40221e00b15b1ebfe13b6f -- developer-run-tests: #4931
23235-desired-pool @ 22caffa10c4b8a9898fb35afdc9fe8ccb9dfdfc2 (adds GOGC=50)
Updated by Brett Smith 5 months ago
Tom Clegg wrote in #note-15:
23235-doc-mem-cpu-profiling @ 8f6a4d60a3be3b773661525c1b1c28319773588b
This works for me, thanks. Is there documentation about go tool pprof that we could add a link to for reference? Maybe https://github.com/google/pprof/blob/main/doc/README.md ? But with or without that this LGTM.
Updated by Brett Smith 5 months ago
Tom Clegg wrote in #note-16:
23235-desired-pool @ 22caffa10c4b8a9898fb35afdc9fe8ccb9dfdfc2 (adds GOGC=50)
What's here LGTM.
A bugbear of mine is when we add "magic settings" like GOGC=50, the reasons we chose that setting tend to get lost to time, and then it becomes this thing that we cargo cult or are afraid to modify. I would like us to document how we arrived at this value in enough detail that we're able to reevaluate if the original rationale still applies in the future.
Bare minimum would be linking to your comment. Better would be adding it to the wiki or directly as developer documentation in the source so that we can update it over time as we learn more, like maybe we get noticeably different results with different OSes or different versions of Go. (On the one hand, I think Git is the thing least likely to get lost. On the other hand, I feel like the graphs are important and I don't want to add them to Git.) I'm open to other suggestions too. And then the GOGC=50 setting should point readers to this documentation.
Thanks.
Updated by Tom Clegg 5 months ago
23235-desired-pool @ 2fa4895fd38c8e550a83fa0d5777a3d30ca24b20
This just adds a comment to keep-balance.service with a short explanation and a link to #note-16.
My preference would be to get memory-over-time charts from grafana on a larger-scale deployment where memory usage is more substantial (like multiple gigabytes) and save that as our evidence/rationale. Performance at small scale is an encouraging sign, but performance at medium/large scale is what matters. WDYT?
Updated by Brett Smith 5 months ago
Tom Clegg wrote in #note-20:
My preference would be to get memory-over-time charts from grafana on a larger-scale deployment where memory usage is more substantial (like multiple gigabytes) and save that as our evidence/rationale. Performance at small scale is an encouraging sign, but performance at medium/large scale is what matters. WDYT?
Sure, that makes sense. Thanks.
Updated by Brett Smith 4 months ago
A very large user has confirmed that these changes cut keep-balance max RAM utilization by more than 50%.